Vault Hunting 101: A Guide to RNG and LOOT!
Discussions of any Borderlands game invariably include a reference to the capricious whims of the Random Number Generator (RNG) at some point. This is usually in the context of how hard or easy it is to get a specific item, or the standard waiver that “random is random” (RiR). Such discussions equally invariably involve claims and counter-claims regarding how the games RNG works, or how it can itself be “gamed” to encourage the desired result.
This guide is not wholly original, but will attempt to cover the key points in a clear and mostly non-mathematical manner for those who don’t spend their working days dealing with statistics. It draws heavily from previous articles, primarily:
- @HeyCarNut’s massive Guide to RNG
- Paul Hellquist’s Inside the Box Loot article part 1
- Paul Hellquist’s Inside the Box Loot article part 2
- @HeyCarNut’s original Drop Guide to drop rate inference
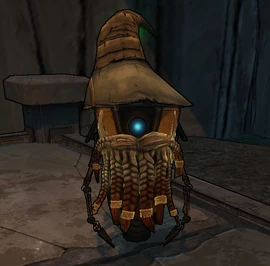
To start with, though, here’s a rare actual photograph of Maya discussing random number generation with CL4P-TP, courtesy of Heycarnut:

Outline:
Real and Pseudo-RNGs
Let’s get this out of the way first: Any computer is incapable of generating truly random numbers; technically, they all use a pseudo-random number generator (PRNG). Given how vital it is to scientific research for PRNGs to generate numbers that are as truly random as possible, considerable efforts have gone in to figuring out how to do this. Both Borderlands 2 (BL2) and The Pre-Sequel (TPS) are built using the Unreal engine, which provides a handy default random function.
As HeyCarNut found, this uses a simple recursive calculation that generates an integer value based on the value from the preceding calculation. Obviously, the very first time this calculation is performed it needs a number to start with: this is called the initial seed value. The Unreal engine uses the current CPU clock cycle count in order to give a different initial seed every time the game is started, meaning that the actual sequence of pseudo-random numbers generated will be
different each time. So how good is this approach in terms of generating random numbers? To quote HeyCarNut:
*Linear-Congruential Pseudo-Random Number Generator. Now you know…
TL,DR: BL2 and TPS may ‘only’ use a PRNG, but it’s good enough that you won’t notice a difference from true random behaviour unless you spend an unhealthy amount of time collectingin-game statistics. The guy below did that: do you really want to look like this guy?

Didn’t think so!
What About the Loot?
So how does the game decide what to give you when you kill something, or open a container? Game developer Paul Hellquist described the process pretty well in an amazingly detailed developer blog post. Every loot source in the game (container, chump, badass, super badass, all the way up to raid boss) has an associated list defining the number of different categories(‘item pools’) of loot it can provide, along with a weighting factor (probability) for obtaining an item from each pool.
The weights are expressed as a decimal number between zero and one, zero obviously meaning “never” and one meaning “guaranteed”. When you open a box or kill an enemy, the game looks up the definition list and, for each entry in that list, uses the PRNG to generate a random number between 0 and 1. If the result is more than the weight, you get nothing from that pool; if it is less than the weight, the game repeats this process with a fresh PRNG result for each item within the pool. The overall process is shown nicely in a flow diagram from Paul’s article:

In Paul’s example, we killed some basic bandit (or scav) who has eight entries in their list definition, meaning they could drop up to 8 items of loot. These are: guns and gear; vehicle skins; money; an eridium bar (single moonstone); four eridium bars (moonstone cluster); health; ammo weighted according to the number of players in the game; and one additional chance of extra ammo.
Paul tells us that the weight for the first category in this table is 0.085 (8.5%, or between 1 in 11 and 1 in 12 odds.) So, if you killed an infinite number of chumps, 8.5% of those kills would result in an item from the gear and weapons pool. Note that other classes of loot source (e.g. ultimate badasses, raid bosses, …) have their own list definitions, meaning that they can drop different numbers of items using either the same or modified loot pools.
Can you game the game?
Let’s pause to address a common misconception: It is often claimed that scaling the output from a PRNG and using a lookup table makes the result less random. While it’s certainly possible to manipulate the output of the PRNG in order to make “more random” while having the opposite effect, this isn’t true of simple linear scaling. Neither does comparing the result to a specified value make the outcome (drop or no drop) any more or less random. This is because when we play the game, we are merely sampling the results we would have obtained from an infinite number of monkeys, er, chumps. Our brains are hard-wired to look for patterns (it avoids thinking too hard), and limited samples of truly random outcomes tend to look like they contain a pattern.
This is demonstrated easily by playing the game and keeping track. (We can also do what HeyCarNut did, and simulate playing the game continuously for several weeks or months.) Following the drop rate increase for example, Savage Lee has 1 in 10 odds (10% or a probability of 0.010) of dropping a legendary Unkempt Harold of some flavour. Let’s do 100 farming runs indicating whether we did (1) or did not (0) succeed. Here’s the outcome, in groups of 10 trials each (because I don’t like farming that much!):
    Day 01: 0 1 0 1 0 0 0 0 0 0  = 2 UHs
    Day 02: 0 0 0 1 0 0 0 0 0 0  = 1
    Day 03: 0 0 0 0 0 0 0 0 0 0  = 0
    Day 04: 0 0 0 0 0 0 0 0 0 0  = 0
    Day 05: 0 0 0 0 0 1 0 0 0 0  = 1
    Day 06: 0 0 0 1 1 0 0 0 0 0  = 2
    Day 07: 0 0 0 0 0 0 0 1 0 0  = 1
    Day 08: 0 0 0 0 0 0 0 0 0 0  = 0
    Day 09: 0 0 0 0 0 0 0 0 0 0  = 0
    Day 10: 0 1 0 0 0 0 0 0 0 0  = 1
Just looking at that data, it’s hard to not notice that the 1st, 3rd, 7th, 9th and 10th columns are all zero. This doesn’t, however, mean every 1st, 3rd, 7th, 9th and 10th time you spawn in Three Horns you should simply quit and restart to save time! After all, if you’d only considered the first 50 tries (first five rows), you’d conclude by the same logic that the 5th, 8th, 15th, 18th, … times were not worth continuing either, but you would have been wrong.
Now suppose I told you that Days 1 and 6 results were obtained driving a bandit technical to Savage Lee’s spawn area, while days 2 and 7 were done driving a racer. Notice how there are twice as many successful drops when driving a technical versus a racer? Sweet! It looks like we’ve found a way of gaming the PRNG by selecting a particular type of vehicle! Except, it just looks that way, because days 4 and 8 were also done driving a technical…
It’s also interesting to see how the observed drop rate varies as the number of runs increases. For our 100 trials, it worked out to 8%, or closer to 1 in 12, but it sure looked higher over the first 20 trials! Here’s how the overall observed drop rate varies for each additional set of ten runs – eventually, we’d expect the observed rate to converge on the actual probability, but it might take a while:

Random loot is random:
Back to Paul’s article. Let’s say that the scaled PRNG value came out to 0.079. This is less than the weight of 0.085, so we get one item from the Gear and Weapons pool. This is further broken down into the item sub-categories: weapons; shields; grenade mods; class mods; and relics (Oz kits in TPS). The weights for each item type are again either predefined values, or are multiplied by some specific modifier. In fact there are two predefined weights used (with or without modifiers) in this pool: a value of 100 for “common” and one of 10 for “uncommon” items.
What’s different here is that the resulting weights are used to determine which type of item the drop will be, so a single item from the list. In this case, the individual weights (taking into account their modifiers) add up to 207. Relics are weighted as most rare, so if the scaled result from the PRNG call is less than 0.0483 (=10/207) the item will be a relic. If the result is greater than 0.5169 (=107/207) it will be a weapon of some sort:
Item            Weight  Threshold  Probability
Relic (Oz kit)    10      0.0483     4.83%
Class mod         22      0.1546    10.63%
Grenade mod       30      0.2995    14.49%
Shield            45      0.5169    21.74%
Weapon           100      1.0000    48.31%
(Note: these numbers date to before the drop rate increase; it’s unknown if they are slightly different now.)
So about half the time, our second PRNG call will give us a weapon, but roughly 1 time in 5 we will get a shield, and roughly 1 time in 20 it will be a relic. This process continues in order to determine the item rarity, the specific type of item, its manufacturer, and even its parts and stats.
Item rarity is determined in a similar fashion: there is a specific table defining the probability of getting each rarity from common chumps. Again, Paul gives us the actual numbers from the game as released:
Colour   Rarity    Probability (rounded)  Chances (approximately)
White    Common       89.92%                   9 in 10
Green   Uncommon       8.99%                   1 in 10
Blue      Rare         0.89%                   1 in 100
Purple  Very Rare      0.09%                   1 in 1000
Magenta   E-Tech       0.09%                   1 in 1000
Orange  Legendary      0.009%                  1 in 10000
Note that with the drop rate increase, that last entry is now 3 in 10000 – better, but still pretty long odds.
Random is mostly random!
I said earlier that players can’t game the PRNG to favour a particular outcome. Indeed, Paul confirms the earlier assertion regarding the PRNG:
However, he also states certain very specific circumstances where the game’s logic rules change what loot can drop. Note that this does not require any changes to the PRNG (random is still random); it simply modifies the entries in the loot tables.
We’ve already seen that more ammo drops from basic enemies with more players, but the process also provides an increased chance of finding the ammo you need most. (Tip: open all the ammo crates in an area before picking any of it up; that way, you keep the odds of finding the type you need in your favour.) Similarly, the probability of finding health is increased when your health is low, and you get an additional chance when it’s very low. Other examples are class mods (more likely to get ones for the characters in the party.
For weapons specifically, the table is altered depending on the game stage (i.e. the level set for the current map when you entered it for the first time on your current mission, or the highest level amongst the party in UVHM.) This is why you only see pistols drop at level 2, you won’t get shotguns or sniper rifles before level 5, and if you see someone wielding a level 9 Norfleet you can be certain that it didn’t drop in the game…
Luck Be A Lady
It’s pretty common to see forum posts that ask questions like:
- Did GBX secretly nerf [loot source]’s drop rates?
- Did GBX secretly buff [loot source]’s drop rates?
- Is [game feature] glitched? I’m not getting my loot…
- Is [game feature] glitched? I’m getting tons of loot…
While some of these can be attributed to missing key announcements about updates and hotfixes (to be fair, they’re often quite dense!), special events (Loot Hunt, drop rate tests), or are a result of known long-standing issues (Boll, Son of Mothrakk), most of the time they simply reflect a run of either bad or good luck.
Part of this is the fact that true randomness is counter-intuitive: an extremely common misconception is that if an event has a 1 in 10 chance of occurring, then it will always happen once in 10 tries. On average it will but, as we saw earlier, sometimes you get different outcomes. Indeed, one of the surest signs that the BL2/TPS random loot generator is based on a good PRNG is that you do get runs of good and bad luck.
Getting the drop on rates
If you want to know whether your observed drop rate is what it should be, or the result of other factors (secret hotfix or glitch), it turns out that size really does matter – sample size, that is. I’ve already given the example of a dedicated legendary drop from one of the games mini-bosses. Here’s a larger example taken from my survey of grinder success rates in TPS. I wanted to get an idea of the probability of grinding an item of higher rarity without using moonstones. With almost 600 trials at this point, the observed rate for grinding three blues into a purple is 40%, or odds of 2 in 5. Here are the first 20 trials, where 0 indicates no deal and 1 indicates success:
Outcome: 1 0 0 0 0 0 0 0 1 0 0 0 0 0 0 0 0 1 1 0
You’ll notice that I got 4 purples in 20 grinds, which is half the rate I finally arrived at. Each group of 5 trials, however, contains 0, 1, or 2 successful grinds. Here’s what the cumulative observed success rate looks like – notice how it varies substantially until past 150 trials:

So how many times do you have to farm a particular loot source if you want to know either (a) the drop rate, (b) if the rate has been changed, or © if you have discovered a new glitch? We could go the statistical route, but I’m going to take a largely practical (and less mathematical) one. The primary guideline I use in deciding the threshold number before I can say much is: Will one more trial outcome substantially change my observed drop rate?
Suppose, for example, I take the first 20 results with an observed rate of 4/20 (=20%). One more successful trial would change that to 5/21 (= 24%), while a failed trial would give 4/21 (=19%). You can see why the numbers vary so much at the beginning of the run! Ideally, I’d like that variation to be less than ±0.5 percentage points, meaning a minimum of 200 trials. If the observed rate was 10%, even after 200 trials it would be hard to tell if the drop rate was really 1 in 10 as opposed to 1 in 9 or 1 in 11. Generally, lower rates require substantially more trials.
The daily (loot) grind
More relevant to actual gameplay experience is the length of each run of successful and unsuccessful outcomes, since that’s what we remember about the game. Here’s the summary for the first few run lengths, where positive values count successive purples and negative ones count successive blues. Notice that there are several runs of quite bad luck, along with some pretty decent runs of good luck:
Run: +1 -7 +1 -8 +2 -1 +1 -6 +1 -1 +2 -1 +3 -2 +4 -1 +1 -4 +4 -2And here’s what the whole thing looks like graphically:

Finally, here’s the distribution of successful and failed run lengths for the blue grinds. The line shows an estimate of the expected number of successful runs for each run length - notice that the scale (on the right) is different, because the observed data didn’t quite match expectations. The general trend is the same, though:

I don’t know if that’s what you expected to see or not; unless you’ve done a fair bit of statistics, my suspicion is probably the “not” category! As Paul Hellquist stated and HeyCarNut demonstrated, the game’s loot system does not keep track of prior outcomes when determining the next one: each grind (in this case) occurs independently of what happened before.
As a consequence, the probability of getting a purple from three blues in any single grind is always the same (p = 2/5 = 0.40); since this is quite high, the probability of getting purples on two consecutive grinds is still pretty good, at 16% (p(2,2) = (2/5)^2 = 0.16). Similarly, for three purples in exactly three grinds, p(3,3) = 0.40^3 = 0.064 (6.4%), and so on. However, as we do more trials, the odds of seeing runs of 2, 3, 4, etc consecutive purples also goes up. So although the odds of 9 purples in exactly 9 grinds are pretty slim (p(9,9) = 0.00026 or 0.026%), it’s not an unexpected event over the course of 600 trials; in fact, we can estimate the probability of at least one run of 9 purples in 600 grinds as about 9%. If you want to know the probability for different run lengths and trials, @HeyCarNut has very kindly run the calculations and plotted the results. Awesome!
When to hold 'em, when to fold 'em
There are a number of quest rewards (Ruby, Lady Fist, Fibber…) and drops from mini-bosses (Unkempt Harold, Bee…) that can be obtained with different parts, some of which are more desirable than others. In the latter case, you can farm for the version you want as often as you like whenever you like. In the former case, however, you can only legitimately obtain the item in game by turning in the quest, and force–quitting if you don’t get the one you want. Given the nature of the PRNG, how many attempts might be required? The short answer is, “A LOT”.
Consider the Fibber, for example: It can spawn with one of three barrel types and either no or one of seven possible accessories. If you’re farming one to use with Gaige, you might also want a shock version. The preferred variant would be a type 2 barrel shock Redundant Fibber. What are the odds? Here are the results of a very limited run of 100 attempts at getting such a beast. Of these, only one was an elemental type 2 Redundant Fibber – a fire version:
Barrel Drops  Accessory  Drops  Element  Drops
Type 1  37    None        73      None     74
Type 2  31    Action       3      Acid      9
Type 3  32    Core         2      Fire      4
              Dynamic      4      Shock     6
              Earnest      4      Slag      7
              Maximized    7
              Redundant    4
              Win-Win      3
Given the number of permutations of barrel, accessory, and element (and ignoring the grip!), 100 trials is far too few to draw any conclusions at all. It gives us enough to do some guesstimating with though. We’ll assume that the parts table for the Fibber gives equal weighting to each barrel type. We’ll also assume that the weighting for no accessory and no element are both 75%, with equal weighting between the other possibilities in each category. The probability of getting the desired Fibber in a single attempt is therefore p = 33% x (0.25/7) x (0.25/4) = 0.074%.
To raise our chance of getting one to 25% would require at least 300 trials! I don’t know about you, but that is way more than I’d be prepared to invest. In fact, even 100 trials to get the data for this post was well beyond painful for me. If you get the desired barrel and accessory with any element, my personal recommendation would be to take it and hit the trade forums if it’s not the element you want. Sometimes, you just have to know when you’re ahead of the game…
That’s it for part 1. If you liked it, stay tuned for part 2: Raid bosses, baby!
 Great work. I have never bookmarked a page in here. Your thread is my first.
